A real guide to every Zionsville neighborhood.
What it actually costs to live in each one, who runs the HOA, what's sold lately, and the schools you're zoned for — gathered from public records and kept current.
Where to start
or browse all 128 ↓The estate enclaves
Pools, parks, and trails
Within reach
Big, established communities
Browse all neighborhoods
Filter by price, amenities, or status — or open the map.
Avg. Sold $328,000
Single Family
HOA managed. Dues: Yes
Avg. Sold $903,000
Single Family
HOA managed. Dues: $117/mo
Avg. Sold $555,000
Single Family
HOA managed. Dues: $42/mo
Avg. Sold $836,000
Single Family
HOA managed. Dues: Yes
Avg. Sold $843,000
Single Family
HOA managed. Dues: $50/mo
Avg. Sold $1,533,000
Single Family
HOA managed. Dues: Yes
Avg. Sold $706,000
Single Family
HOA managed. Dues: $67/mo
Avg. Sold $635,000
Single Family
HOA managed. Dues: $19/mo
Avg. Sold $484,000
Single Family
HOA managed. Dues: $44/mo
Avg. Sold $659,000
Single Family
HOA managed. Dues: Yes
Avg. Sold $646,000
Single Family
HOA managed. Dues: Yes
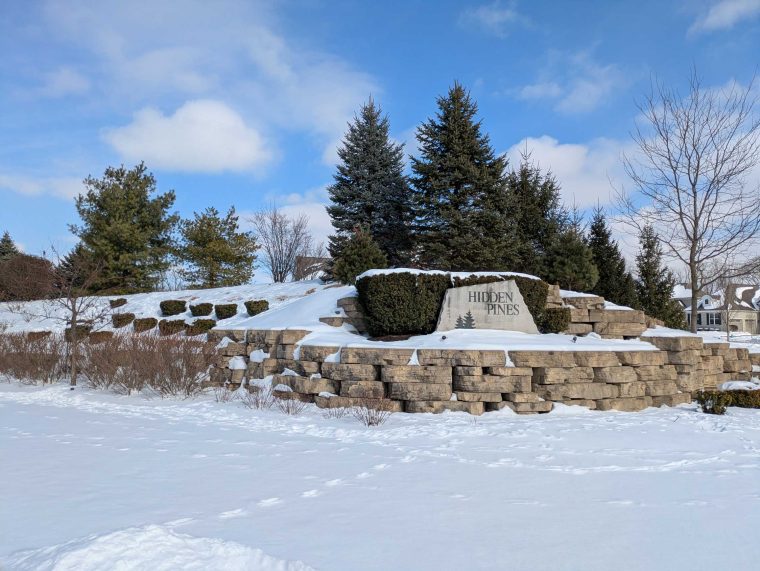
Hidden Pines
Sold OutAvg. Sold $823,000
Single Family
HOA managed. Dues: $69/mo
Avg. Sold $1,923,000
Single Family
Avg. Sold $358,000
Single Family
HOA managed. Dues: Yes
Avg. Assessed $1,350,000
Single Family
HOA managed. Dues: $100/mo
Avg. Sold $275,000
Condo
HOA managed. Dues: Yes
Avg. Sold $637,000
Single Family
HOA managed. Dues: Yes
Avg. Assessed $1,629,000
Single Family
HOA managed. Dues: Yes
Avg. Assessed $2,567,000
Single Family
HOA managed. Dues: Yes
Avg. Sold $490,000
Single Family
HOA managed. Dues: Yes
Avg. Sold $921,000
Single Family
HOA managed. Dues: Yes
Avg. Sold $284,000
Condo
HOA managed. Dues: Yes
Avg. Sold $728,000
Single Family
HOA managed. Dues: Yes
Avg. Sold $622,000
Single Family
HOA managed. Dues: Yes
Avg. Sold $1,443,000
Single Family
HOA managed. Dues: Yes
Avg. Sold $725,000
Single Family
HOA managed. Dues: $125/mo
Avg. Sold $602,000
Single Family
HOA managed. Dues: $33/mo
Avg. Sold $1,047,000
Single Family, Condo
HOA managed. Dues: $83/mo
Avg. Sold $652,000
Single Family
HOA managed. Dues: $4/mo
Avg. Sold $634,000
Single Family
HOA managed. Dues: $33/mo
Avg. Sold $1,032,000
Single Family
HOA managed. Dues: $107/mo
Avg. Sold $756,000
Single Family
HOA managed. Dues: Yes
Avg. Sold $414,000
Single Family
HOA managed. Dues: $21/mo
Avg. Sold $595,000
Single Family
HOA managed. Dues: Yes
Avg. Sold $2,356,000
Single Family
HOA managed. Dues: Yes
Avg. Assessed $417,000
Single Family, Townhome
About Zionsville's neighborhoods
Relocating to Zionsville means stepping into a market with real range, both in price and in the kind of life a neighborhood offers. The town spreads across 128 subdivisions and roughly 9,576 homes, and there is recent sale history for 120 of those neighborhoods, with about 6,260 homes changing hands over the past five years. The typical home sells for about $509,000, the town-wide median, while the average runs higher at roughly $605,000. That gap between the two numbers is worth pausing on: a relatively small number of very expensive enclaves pull the average upward, while the median is the more honest anchor for where most of the market actually sits.
It helps to think of that market in four price tiers. The largest group, 52 neighborhoods, falls between $400,000 and $700,000, the broad middle where most relocating families will concentrate their search and find the widest selection. Below that, 26 neighborhoods average under $400,000, the most accessible end of town. Another 26 land between $700,000 and $1 million, and 16 carry averages above $1 million. So while Zionsville carries a reputation for expense, more than a third of its neighborhoods price under $400,000 or in the lower half of that wide middle band, and only a minority cross the seven-figure line.
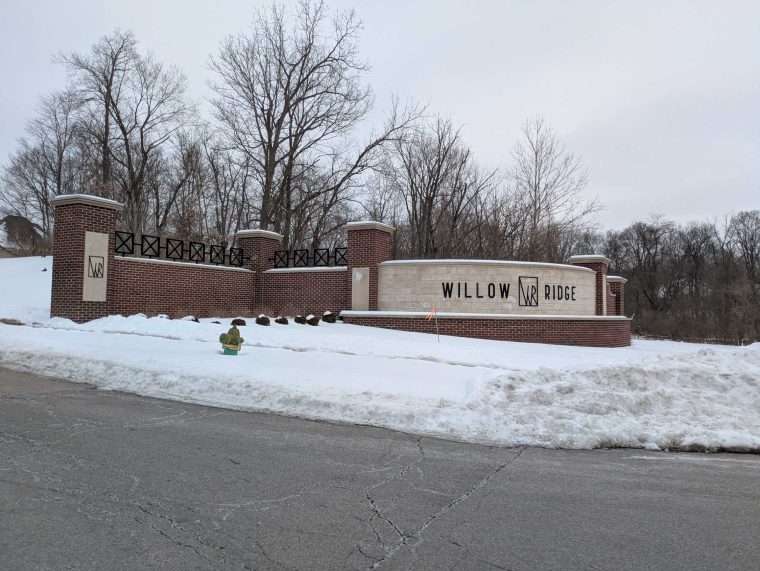
The full spectrum is dramatic. At the affordable end, Russell Lake averages about $262,000, with Lake View near $272,000, Hunter Glen around $275,000, and Olde Dominion just over $284,000. These are the neighborhoods worth knowing if your budget sits closer to a quarter-million than half a million, and they let you buy into the area without stretching to the median. At the opposite extreme, Willow Ridge averages north of $2.2 million, Oldfield runs about $1.8 million, and Clifden Pond sits near $1.34 million, where the price typically buys scale and privacy rather than shared amenities. Between Russell Lake and Willow Ridge there is roughly an eightfold difference in average price, which means a buyer's experience of the same town depends almost entirely on where in that spectrum they land.
Lot size cuts across price and is its own decision. Lots here range from as little as 0.06 acres up to six and a half acres, an enormous spread. If acreage and elbow room matter to you, the larger lots tend to live in the upper price tiers, and you should expect to pay for that land; if you would rather have less yard to maintain and more shared infrastructure, smaller lots in the middle tiers make more sense.
Scale shapes daily life as much as any single feature. The largest communities are Eagles Nest with 550 homes, Cobblestone Lakes with 419, and Stonegate with 372. A bigger neighborhood usually means more neighbors, more children for your own kids to meet, and the critical mass that supports shared spaces, traded against more density and less seclusion. Amenities follow a similar logic, and the data is specific. About 40 percent of subdivisions have a homeowners association, which is the mechanism that funds and maintains shared features, and it brings dues and rules worth confirming before you commit. Across town, ponds are the most common feature at 29 neighborhoods, followed by pools and sports courts at 14 each, trails at 11, and playgrounds at 9. If your household will actually use a pool or courts every week, you are choosing from a genuinely limited set, so amenities should move up your priority list rather than sit as a bonus. Cobblestone Lakes leads with five amenities, while Eagles Nest and Brookhaven each carry four. Notably, two of the largest neighborhoods are also among the most amenity-rich, a meaningful overlap if you want both a big community and plenty of shared space within it.
For many relocating families, schools are the deciding factor, and every neighborhood in town falls within Zionsville Community Schools. At the elementary level, the district is served by six schools: Boone Meadow, Eagle, Pleasant View, Stonegate, Trailside, and Union. Because elementary assignment generally follows where you buy, two homes in the same price range can route to different buildings, so it is worth confirming the specific feeder for any address you are serious about, especially if continuity for a child already enrolled matters to you.
Put practically, the way to navigate Zionsville is to name the two or three things your household cares about most and let them narrow the field before you tour anything. A family on a budget might start with Russell Lake or Hunter Glen and accept fewer shared features. A family that wants a pool, courts, and plenty of playmates should look hard at Cobblestone Lakes or Eagles Nest and budget accordingly. A buyer prioritizing acreage and privacy should expect to engage the million-dollar-plus tier where Clifden Pond, Oldfield, and Willow Ridge sit. The school district is the same across all of them, so the real decision is how you weight price, land, amenities, and scale against one another. With 120 neighborhoods carrying enough sales history to compare on those terms, the information exists to make a deliberate choice rather than a hopeful one, which is exactly what you want when you are committing to a place for years.